Training Path Module 5: Difference between revisions
| Line 238: | Line 238: | ||
Then click PDF Preview - it will show you your PDF. Export this report by selecting the button at the top of the page and then the three dots to be taken to the folder that contains your file. | Then click PDF Preview - it will show you your PDF. Export this report by selecting the button at the top of the page and then the three dots to be taken to the folder that contains your file. | ||
[[File:PDF Preview.png|700px| | [[File:PDF Preview.png|700px|automet® FAB - Analysis - Visual Report - PDF Preview]] | ||
=Reports= | =Reports= | ||
Revision as of 14:38, 20 August 2026
Overview
By selecting Visual Report from the main screen after you have finished a survey, you can see how your measured data compares to the original design data.
The user can then use the tools within the visual report to look at the data in a variety of different ways. The survey data can be rotated and translated, flanges can be fit, unfit or zeroed, and you can also choose how the software prioritises particular data.
This detailed section will try to show you how all of these tools work so you can understand your survey results.
Take your time with the information and try to practice alongside it.
-
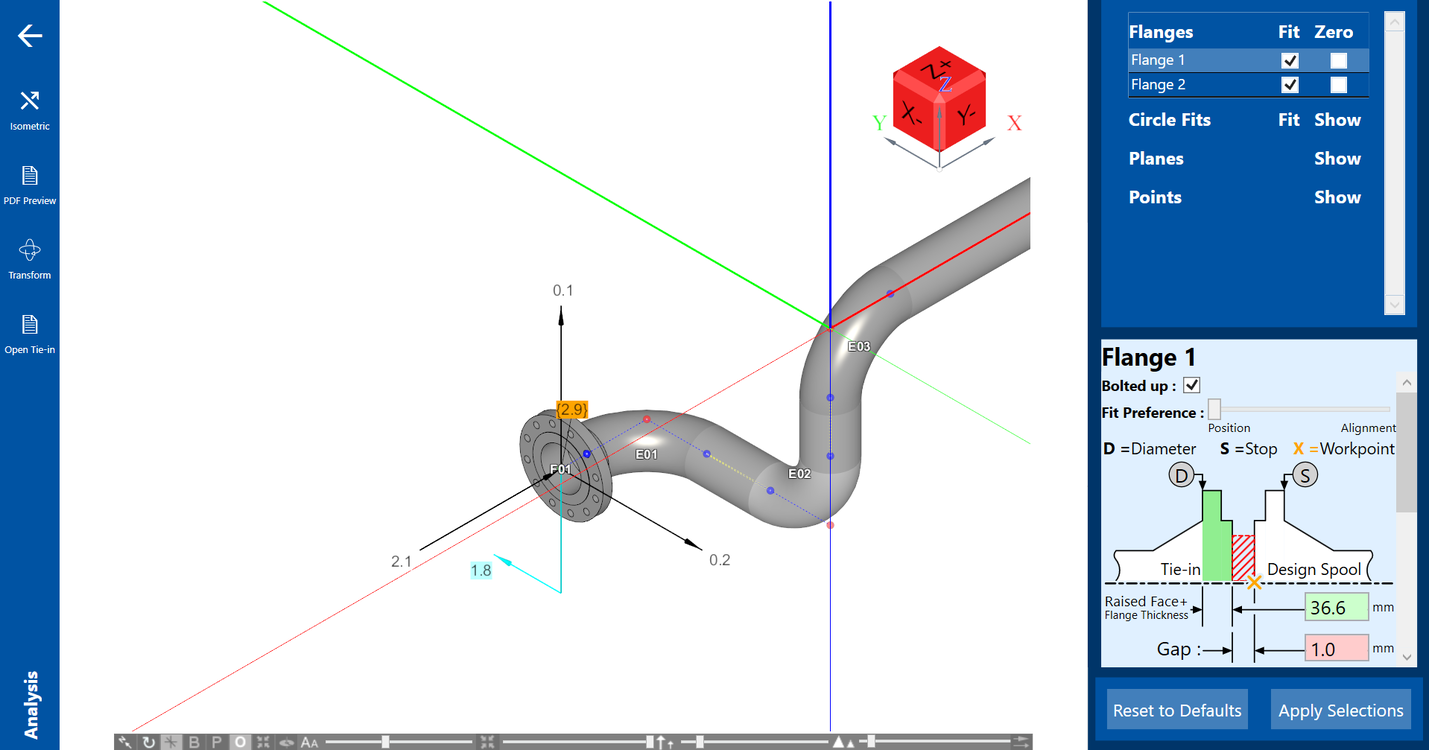 Example survey results

Files
To view a survey within analysis, you will always need two files: survey (.SUR) and design (.DES).
If you want to open a previous survey file, load the SUR file by pressing the Open for Analysis to the right of Survey File: - the design should load automatically.
If you have just completed a survey, the files will already be in place, and you can just click Visual Report.

Drawing Controls
There are a variety of controls within the vector error graphical report. See the images to view a full list of all the available controls.
Main Button Overview

Iso Controls
-
 automet® FAB - Controls for Iso View - North
-
 automet® FAB - Controls for Iso View - B Button
-
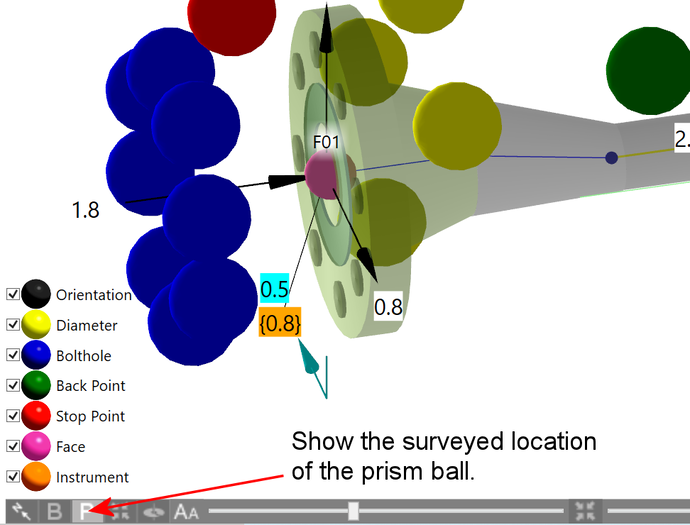 automet® FAB - Controls for Iso View - P Button
-
 automet® FAB - Controls for Iso View - Full Shrink
-
 automet® FAB - Controls for Iso View - Full Size
-
 automet® FAB - Controls for Iso View - Free or Turntable


Iso Controls Expanded
-
 Further controls

Flange Information and Controls

Bolted up
The software algorithm automatically sets the bolted-up condition if it expects (based on survey data) that the flange is bolted up. This is determined by calculating the distance between the diameter-point plane and the stop point.
If the flange is not bolted up, the user can override it.
Diameter - Stop - Workpoint
The circled D (diameter point plane) and S (stop point) indicate the where you took these measurements during your survey.
The tie-In flange and the design spool refer to the pipe spool loaded at the start of the survey.
Gap and flange thicknesses can be updated to tape-measured values; the database defaults are displayed initially.
Ignore length
This option ignores the vector in the direction of length.
When a pipe spool has pipe ends (i.e. open ends of pipe with no flanges), the default is to ignore the length. The length error is not considered and does not affect the best fit. This option allows for pipe over length. If this is not the case, then the pipe over length would affect the report results, so by default, pipe lengths are ignored.
Any flange can be configured to ignore length (if necessary), and any pipe open end can be configured not to ignore length.
Fit preference
The fit preference slider controls the best-fit weighting for each flange/pipe end.
- Position prioritises reducing the vector/positional error (the black arrows).
- Alignment prioritises reducing the the touch point error (gold value) or the alignment of the flange faces.
All surveys deafult to position unless there is a large error, and then the user will have the option to change all flanges to alignment from the outset.
The slider also allows you to balance the preference between the two. You can play with this to see if theres a position you prefer. Just use the Reset to Deafualts button to get back to where you started - your data is never corrupted.
Individual Bolthole Observations
There is a table under the flange which displays each of the bolthole measurements taken.
For your selected flange, you can see the pitch (the angle between the boltholes) and radius (the difference from the database radius) errors for each bolt-hole measurement.
If you see a large error with one of the measurements, you might want to take this out of the calculation, as it could distort the real assessment of PCD etc. Use the Fit checkbox to do this.
When checking pipe ends, the radius errors are diameter points.
Touchpoint at OD
The size of the gap opposite the touchpoint is normally displayed for the location at the flange raised face.
If this option is selected, the size of the gap will be displayed at the flange outside diameter .
Pos/Face error
These are for internal use - they can be ignored.
Arrow/Touchpoint size
The size of the vector error arrow can be changed for an individual flange or pipe end.
Additionally, the length of the touchpoint leader-line can be changed for an individual flange or pipe end
Fit Checkbox
Vector error graphical analysis is used to access and manipulate survey data; it also displays survey information such as flange thicknesses and the types of devices used.
- The fit check box allows you to include spool elements in the fit. Unchecking this box removes that item from the mathematical best-fit analysis, but does not remove the values from the report.
- Show for circle fits reveals or hides the circle fit values on the report.

Zero a Flange
You can isolate a gross error using the fit and zero options within the automet analysis section.
By default, automet will average out the error on all flanges and give you the best-fit option. All surveyed data points have been fitted to the design using a method known as least-squares averaging. Importantly, this method masks gross errors. We can use the option to drop a flange from the fit to show us where gross errors are located.

First, we zero flange one by selecting the zero-option box at flange one. Press the apply selections button to see the change in the visual report.
The zero option does not change the report's orientation - the coordinates are translated; shifted along the grid lines, to match the design co-ordinates at flange one.
You can now see that flange one has zero vector errors.


This pipe-spool report contains some gross errors. You can see this at the touch points on both flanges - there are also large vector errors at flange two.

Dropping a Flange From the Fit
For this example, the zero option at flange one has been unchecked, as it will have no effect on the outcome of the next action. We uncheck the fit at flange two.
We call this 'dropping a flange from the fit'.
Dropping a flange from the fit has a significant impact and the report now looks very different. Only F01's surveyed data points have been fitted to the design.
Because there are only two flanges, flange one can be zero in all aspects, including position, orientation, and alignment. Even though flange two was not included in the fit, its position, orientation, and alignment are still displayed.
Here is a pipe spool with more than two flanges.

Manually Moving the Spool
The transform button allows the user to alter survey data with six degrees of freedom. This means that the survey results can be translated and rotated around the X,Y, and Z axes.

Align to the Grid
Rotate
Translate
Open Tie-In
If you have completed an open-tie in survey, you must select this button to tell the system, otherwise you will have an inaccurate survey.
Selecting the button on the left makes it available. Select each flange and turn it on or off using the checkbox within the right hand box for each flange.

PDF Preview
When youre ready to produce your report - organise the spool on screen so that you can see all of the relevant information clearly.
Then click PDF Preview - it will show you your PDF. Export this report by selecting the button at the top of the page and then the three dots to be taken to the folder that contains your file.

Reports
Three reports can be generated: Visual, Text and QA.
The text and QA reports are available after setting up the survey data in the visual report interface.
The visual report transforms the survey data and compares it to the design.
Visual Error Report
The first and most crucial thing to know is that all values presented are deviations from the design, and if the pipe spool was manufactured exactly as per the design, all values would be zero.

Vector Errors
The black arrows show the measured error in your selected units and in a particular direction (X, Y and Z). The below flange was measured 1.4 mm too high, 0.6 mm too far north and 0.8 mm too far east. Fixing these errors means moving the flange in the opposite direction to the arrows by the stated amount.

Bolt Hole Rotation
The blue arrows show the rotational error in mm and the direction of the error.

Touch Point
The adjoining flange will touch here first where the line from the centre of the flange crosses the outer edge of the raised face (or OD if its a flat face flange) - this is the high point. Move the flange back towards the pipe, by the stated amount to fix the error.

Open Pipe Ends Touch Point
The adjoining pipe will touch where the line crosses the outer edge of the pipe first – this is the long point.

Text Report
How do you get the text report?
The Text Report can be generated once you've created the 'Vector Error Graphical Report', shown on the left below. Once you've set this up, the text report will be available on the main screen.
What does the text report show?
The text report includes QA and user input data, as well as actual and design spool alignment, orientation, and coordinates, with comparisons.

What can you use the text report for?
These reports are very useful when doing site surveys and needing to know exactly where flanges currently sit.
Flange information

D-Point Location
As shown above, the text report will display the locations of the observed diameter ('D') points.
When reviewing an analysis, it is important to check the location of the 'D' points as well as the thickness of the flange and gasket.

Flange/Pipe-End Locations

Plane-Point Locations

Individual Point Locations

Flange Mid-Point Locations

QA Report
Overview
The QA Report can be generated once you've created the 'Vector Error Graphical Report', shown on the left below.
The QA Report includes flange numbers, specifications of flanges in the design file, and the device type used to conduct the survey.
- The Coverage is the area of the flange circumference covered during the survey.
- The Plane value represents how flat the observations were on the flange.
- The Pitch value is the difference between bolt-hole observations in millimetres.
- The Location represents the 'D' point placement on the flange.
- The Diameter Avg is the actual flange diameter difference from the database value.
- The Diameter Max is the flange out of roundness, checked to show a misplaced ‘D’ point.
- PCD is the Pitch Circle Diameter
- The PCD Avg is the actual flange PCD difference from the database value.
- The PCD Max is the bolthole out of roundness, checked to show a misplaced bolt-hole magnet.

When a support is measured, the QA Report displays a conformation of the base plate sizes against the values in the design file. The base plate design dimensions are also displayed.
When the survey instrument is moved, the QA Report displays the number of moves, mutual control points, and maximum fit error between the various instrument setups.

Plane
The maximum error from a plane across the flange face. This happens when the type 7 is lifted upwards for some reason. If your error is larger than 2 mm you will get a warning.

Max OD
This is the maximum error from a circle. If one of the points sits outwards from the flange for some reason, the normally circular flange becomes elongated.

PCD Error
Pitch circle diameter error (PCD)/Bolt circle diameter - the circle that passes through all the boltholes.


Max Pitch (Angle) Error
The error in the angle between bolt boles (in mm).


QA Report During Capture
The QA data integrity report is also available during capture. This is convenient because irregularities can be resolved during the capture process which avoids the need for another survey.
-
 Example of the live QA report during capture
-
 Example of the live QA report during capture

