Training Path Module 5: Difference between revisions
No edit summary |
|||
| Line 50: | Line 50: | ||
<div style="margin:16px 0 20px 0; padding:16px 20px; border:1px solid rgba(128,128,128,0.35); border-top:4px solid #3366cc; border-radius:6px; background:#ffffff; text-align:center;"> | <div style="margin:16px 0 20px 0; padding:16px 20px; border:1px solid rgba(128,128,128,0.35); border-top:4px solid #3366cc; border-radius:6px; background:#ffffff; text-align:center;"> | ||
<div style="font-weight:bold; font-size:110%; margin-bottom:8px; color:#3366cc;">Main Visual Report Interface Overview</div> | <div style="font-weight:bold; font-size:110%; margin-bottom:8px; color:#3366cc;">Main Visual Report Interface Overview</div> | ||
[[File:analysis visual report details.png|center| | [[File:analysis visual report details.png|center|800px]] | ||
</div> | </div> | ||
Revision as of 08:17, 23 October 2026
Overview
Selecting Visual Report from the main application menu following a survey compares captured field observations against design specifications (`.DES`).
The visual analysis suite enables surveyors to rotate and translate models, include or exclude specific flanges from least-squares fit calculations, zero individual tie-ins, adjust fit weighting preferences, and isolate gross fabrication errors.
-
 Graphical visual analysis display comparing survey to design

File Dependencies and Opening Surveys
Analyzing survey data requires two corresponding files:
- Survey File (`.SUR`): Contains observed field coordinate data.
- Design File (`.DES`): Contains baseline CAD model geometry.
To analyze a previously completed survey, select Open for Analysis adjacent to **Survey File:** on the main interface—the corresponding design file loads automatically. If a survey was just completed, click Visual Report directly.
-
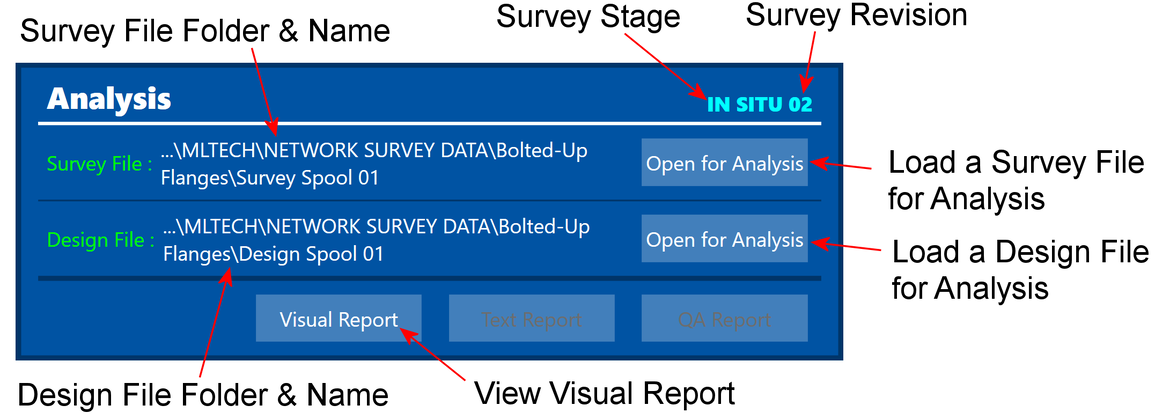 Main menu analysis launch controls

Visual Report Controls
Navigation and Interface Controls


Video guide: Controls for Iso View in Analysis (2:41)
Summary: Demonstrates camera rotation, wheel zoom, mouse pan, camera resets, showing observed point spheres, scaling vector arrows, and adjusting model shrink parameters.
Manual Transforms and Model Adjustments
The **Transform** module allows surveyors to alter survey data with six degrees of freedom by translating and rotating models around the X, Y, and Z axes.

<div style="font-weight:bold; font-size:105%; margin-