Training Path Module 5
Overview
Selecting Visual Report from the main application menu following a survey compares captured field observations against design specifications (`.DES`).
The visual analysis suite enables surveyors to rotate and translate models, include or exclude specific flanges from least-squares fit calculations, zero individual tie-ins, adjust fit weighting preferences, and isolate gross fabrication errors.
-
 Graphical visual analysis display comparing survey to design

File Dependencies and Opening Surveys
Analyzing survey data requires two corresponding files:
- Survey File (`.SUR`): Contains observed field coordinate data.
- Design File (`.DES`): Contains baseline CAD model geometry.
To analyze a previously completed survey, select Open for Analysis adjacent to **Survey File:** on the main interface—the corresponding design file loads automatically. If a survey was just completed, click Visual Report directly.
-
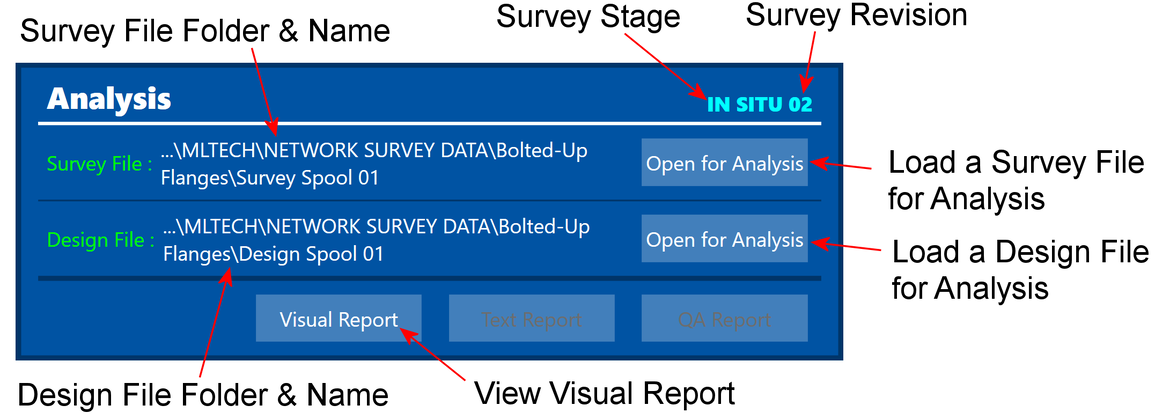 Main menu analysis launch controls

Visual Report Controls
Navigation and Interface Controls
-
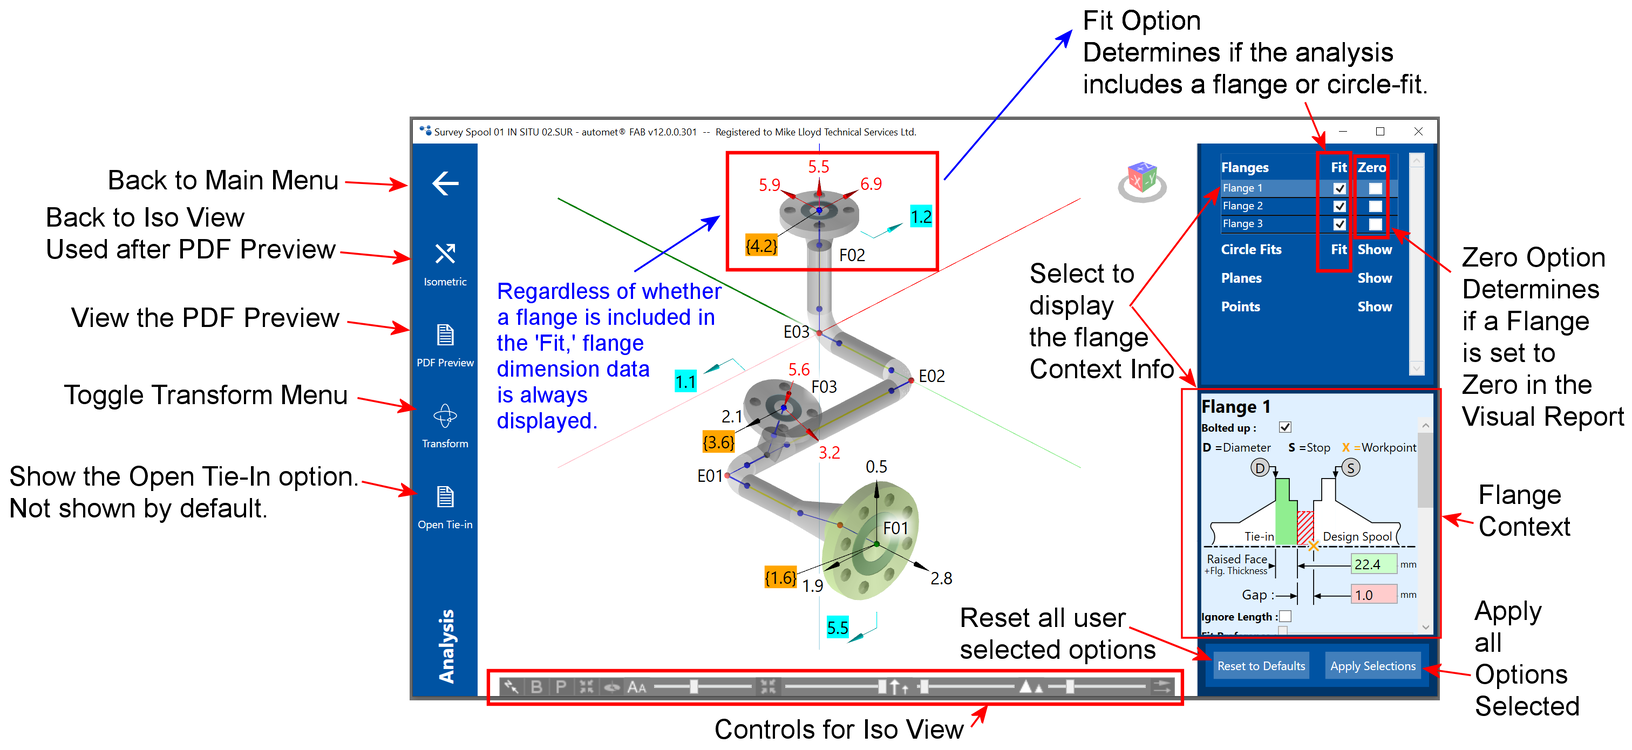 Main visual report button layout

-
 Reset camera view (North to top-left)
-
 Toggle back vectors on/off
-
 Toggle observed points spheres on/off
-
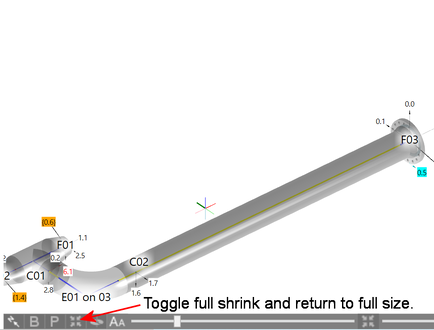 Toggle model full shrink
-
 Toggle model full size
-
 Toggle free rotate vs. turntable mode


-
 Expanded viewer controls and display scaling sliders

Video guide: Controls for Iso View in Analysis (2:41)
Summary: Demonstrates camera rotation, wheel zoom, mouse pan, camera resets, showing observed point spheres, scaling vector arrows, and adjusting model shrink parameters.
- North Arrow: Resets camera orientation so North points top-left.
- B Button: Toggles display of back vectors on/off.
- P Button: Toggles observed data point spheres on/off.
- Shrink Buttons: Toggle full model shrink or restore to full size.
- Free Rotate: Switch between free-orbit rotation and turntable mode.
-
 North view reset
-
 Toggle back vectors
-
 Toggle point spheres
-
 Full shrink
-
 Full size
-
 Turntable / Free rotate
- Vector Scaling: Adjust size and arrowhead dimensions for vector arrows.
- Font & Label Scaling: Customize text dimensions across the model.
- Point & Opacity Controls: Adjust sphere sizes, leader lengths, and transparency.
-
 Expanded viewer controls and display scaling sliders
Video guide: Controls for Iso View in Analysis (2:41)
Summary: Demonstrates camera rotation, wheel zoom, mouse pan, camera resets, showing observed point spheres, scaling vector arrows, and adjusting model shrink parameters.
- Resets camera orientation so North points to the top-left.
-
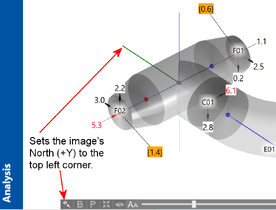 North view reset
- Toggles display of back vector error arrows on and off.
-
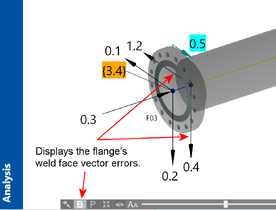 Toggle back vectors
- Toggles observed survey data point spheres on and off.
-
 Toggle point spheres
- Fully shrinks component lengths to highlight flange orientations.
-
 Full shrink view
- Restores pipe spool model to full proportional length.
-
 Full size view
- Switches between free 3D orbit rotation and turntable mode.
-
 Free rotate / turntable
- Sliders: Adjust font dimensions, shrink ratios, vector arrow scaling, arrowhead sizes, opacity, and positional tolerance thresholds.
-
Expanded viewer controls and display scaling sliders
Video guide: Controls for Iso View in Analysis (2:41)
Summary: Demonstrates camera rotation, wheel zoom, mouse pan, camera resets, showing observed point spheres, scaling vector arrows, and adjusting model shrink parameters.
Manual Transforms and Model Adjustments
The **Transform** module allows surveyors to manually translate and rotate survey models across six degrees of freedom (X, Y, Z axes).
-
 Analysis transform interface

Open Tie-In Surveys
When analyzing open tie-in site surveys, enable the **Open Tie-In** function to prevent coordinate fit distortions.
-
 Open tie-in analysis control panel

Report Generation
automet® FAB generates three specialized documentation reports following analysis setup:
Visual Error Report
3D graphical view displaying vector arrows, rotational offsets, and face touch-point gap dimensions.
Text Report
Tabular coordinate listing showing actual vs. design coordinates, D-point locations, and alignment angles.
QA Integrity Report
Quality audit verifying face planarity, PCD errors, device types, and multi-setup instrument move precision.
Visual Error Graphical Report
All displayed values represent deviations from design; a perfectly manufactured spool yields all **zero values**.
-
 Full 3D graphical visual error report

- Vector Errors (Black Arrows): Indicate displacement magnitude and direction (+1.4 mm Z, +0.6 mm Y North, +0.8 mm X East). Correct by adjusting physical flange in the opposite direction (-1.4 mm Z, -0.6 mm South, -0.8 mm West).
- Bolt-Hole Rotation (Blue Curved Arrow): Shows rotational error magnitude (in mm) and direction.
- Touch Point (Gold Value): Identifies the raised-face high point contacting the mating flange first. The value represents the gap opening on the opposite side.
- Open Pipe End Long Point: Identifies the longest point on un-flanged pipe ends to guide field bevel grinding.
-
 Positional vector error arrows
-
 Bolt-hole rotational error arrow
-
 Flange touch point high-point gap
-
 Open pipe end long-point gap


Text Report
Contains tabular alignment, orientation, and global coordinate comparisons essential for field site surveys.
-
 Text report coordinate summary page

-
 Flange specification and gasket summary
-
 Calculated work point centerlines
-
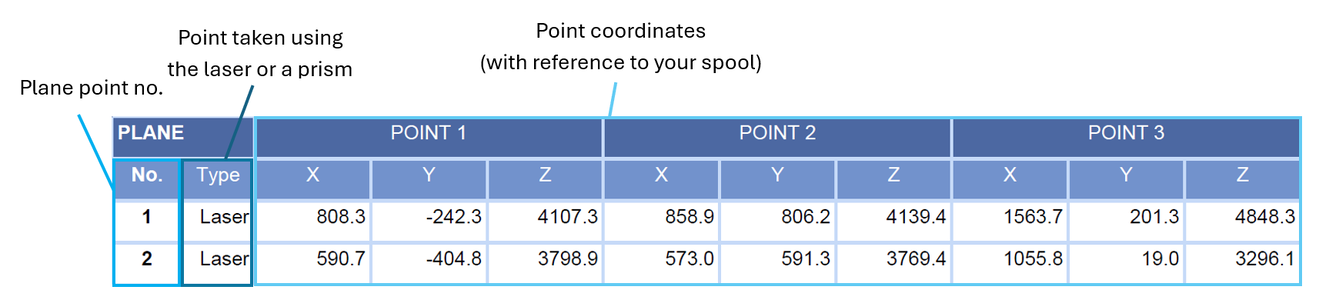 Plane point coordinate locations
-
 Individual observed point coordinates
-
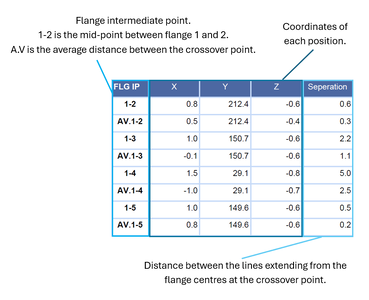 Flange midpoint coordinate summary


-
 D-point location reference states

QA Integrity Report
Validates observation quality, face flatness (plane error), target seating (Max OD error), and instrument setup resection accuracy across multiple station moves.
-
 QA integrity report page 1
-
 QA integrity report page 2 (support plates and instrument moves)


-
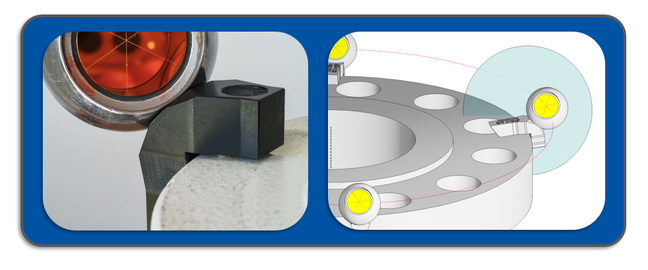 Plane error warning (face planarity > 2 mm)
-
 Max OD circle error (unseated target device)
-
 Pitch Circle Diameter (PCD) error diagram
-
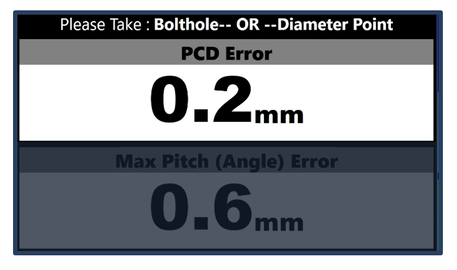 PCD deviation readout
-
 Max bolt-hole pitch error diagram
-
 Max pitch angle deviation readout


Live QA Report During Capture
QA integrity reports can also be reviewed live during survey capture via the **Objects Tab**, allowing operators to identify and re-shoot flawed points before disturbing total station setups.
-
 Live capture QA report view 1
-
 Live capture QA report view 2


PDF Export Preview
To generate customer-facing PDF documentation, align the 3D model on screen to present all relevant callouts clearly, then click **PDF Preview**.
-
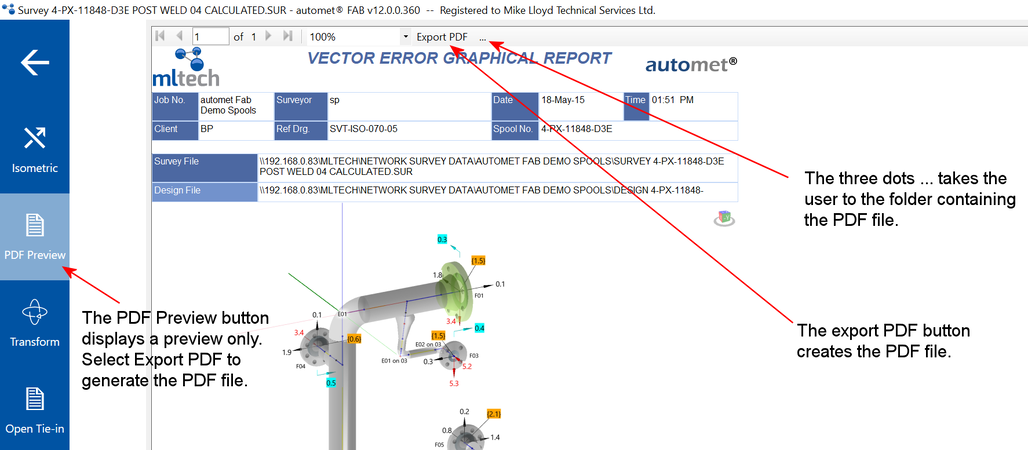 PDF export preview window

Training Path Completion & Next Steps
Congratulations on completing the **automet® FAB Self-Guided Learning Path**.
To continue expanding your technical expertise, explore the following specialized workflows:
- Automet® FAB - Site Survey – Detailed field site survey procedures.
- Automet® FAB - Control Capture Methods – Advanced resection networks and control station management.
- Pressure Vessels – Modelling and surveying pressure vessel nozzles and shell alignments.
For technical assistance or training inquiries, contact MLTech support at **info@mltech.co.uk**.