Training Path Module 5
Overview
Selecting Visual Report from the main application menu following a survey compares captured field observations against design specifications (`.DES`).
The visual analysis suite enables surveyors to rotate and translate models, include or exclude specific flanges from least-squares fit calculations, zero individual tie-ins, adjust fit weighting preferences, and isolate gross fabrication errors.
-
 Graphical visual analysis display comparing survey to design

File Dependencies and Opening Surveys
Analyzing survey data requires two corresponding files:
- Survey File (`.SUR`): Contains observed field coordinate data.
- Design File (`.DES`): Contains baseline CAD model geometry.
To analyze a previously completed survey, select Open for Analysis adjacent to **Survey File:** on the main interface—the corresponding design file loads automatically. If a survey was just completed, click Visual Report directly.
-
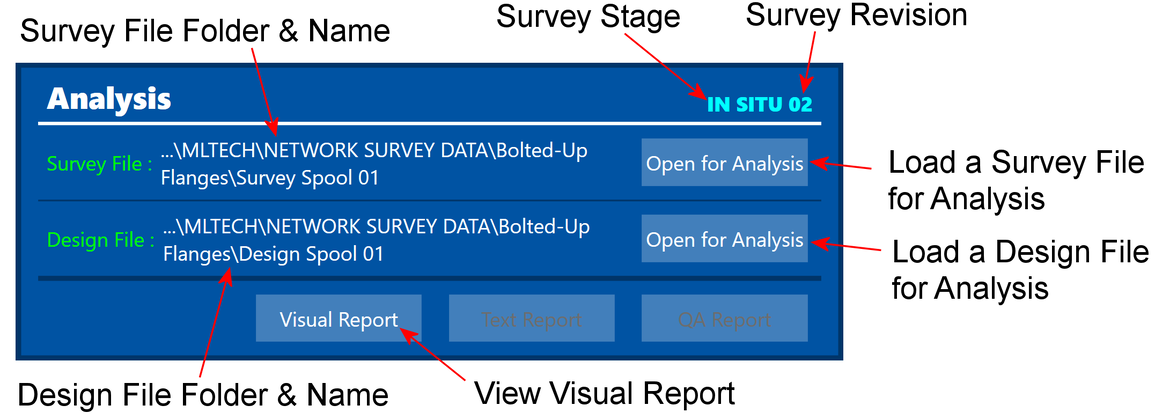 Main menu analysis launch controls

Visual Report Controls
Navigation and Interface Controls


Video guide: Controls for Iso View in Analysis (2:41)
Summary: Demonstrates camera rotation, wheel zoom, mouse pan, camera resets, showing observed point spheres, scaling vector arrows, and adjusting model shrink parameters.
Manual Transforms and Model Adjustments
The **Transform** module allows surveyors to alter survey data with six degrees of freedom by translating and rotating models around the X, Y, and Z axes.

Open Tie-In Surveys
When analyzing open tie-in site surveys, enable the **Open Tie-In** function to prevent coordinate fit distortions.

Report Generation
automet® FAB generates three specialized documentation reports following analysis setup:
Visual Error Report
3D graphical view displaying vector arrows, rotational offsets, and face touch-point gap dimensions.
Text Report
Tabular coordinate listing showing actual vs. design coordinates, D-point locations, and alignment angles.
QA Integrity Report
Quality audit verifying face planarity, PCD errors, device types, and multi-setup instrument move precision.
Visual Error Graphical Report
All displayed values represent deviations from design; a perfectly manufactured spool yields all zero values.


Text Report
Contains tabular alignment, orientation, and global coordinate comparisons essential for field site surveys.


QA Integrity Report
Validates observation quality, face flatness (plane error), target seating (Max OD error), and instrument setup resection accuracy across multiple station moves.


Key QA Validation Parameters


Live QA Reports During Data Capture
QA integrity metrics can be evaluated live during data capture via the **Objects Tab**, allowing surveyors to identify and re-shoot misplaced points prior to moving the total station.


Training Path Completion & Next Steps
Congratulations on completing the **automet® FAB Self-Guided Learning Path**.
To continue expanding your technical expertise, explore the following specialized workflows:
- Automet® FAB - Site Survey – Detailed field site survey procedures. - Automet® FAB - Control Capture Methods – Advanced resection networks and control station management. - Pressure Vessels – Modelling and surveying pressure vessel nozzles and shell alignments.
For technical assistance or training inquiries, contact MLTech support at **info@mltech.co.uk**.